CEDAR FALLS, IOWA – AgencyBloc, an agency management system/CRM built specifically for life and health insurance agencies, has released a valuable enhancement to its SaaS platform for insurance agencies. The enhancement brings clarity to an agency’s book of business through real-time analytics and graphs, which allows an agency to make informed business decisions.
As insurance agencies face increased competition, the ability to make informed business decisions at a rapid pace has become vitally important.
Blue Hill Research says, “At the highest levels of decision-making, we must make challenging leaps of understanding in the face of nuance and uncertainty. We often rely on data and analysis in tandem with our intuition to guide our process. Making analysis more digestible to the human mind through data visualization is an important element in complementing our decision-making.”
Jennifer Warne, Product Manager at AgencyBloc agrees. “When asked to rank upcoming product features, our clients told us that being able to analyze data visually was key,” Warne said. “Giving insurance agencies the tools they need to outsell their competition, retain important business, and make quick, salient business decisions is very important to us. For this reason, AgencyBloc adjusted our product roadmap to bring visual analytics to our client community sooner rather than later.”
Although agencies have historically run reports, created manual graphs via Excel spreadsheets or searched for third-party vendors to visualize their data, these options are time-consuming and often expensive. AgencyBloc sought to overcome these obstacles, by providing visualizations driven by real-time data at no additional cost.
The goal of AgencyBloc’s Dashboard Analytics is to provide the information agency owners need to answer the following questions:
- How productive is the agency?
- Where does most of the agency’s business come from?
- Which carriers does the agency have most of its business with?
- Which products sell well, which don’t?
- Where are the cross-sell opportunities?
- Who are the agency’s top performing agents?
Agency owners can monitor the various parts of their business and identify opportunities in the following ways:
- Activities/To-do’s: Measure productivity by tracking the status and completion activities.
- Groups: Monitor where group business comes from, top lead sources, and understand the group sales cycle.
- Individuals: Manage the efficiency of the sales cycle with graphs showing Individual status and type (client, prospect, ex-client, etc.).
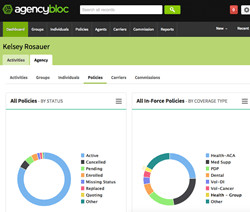
- Policies: Identify cross-sell opportunities and see what coverage types hold the most business.
- Carriers: Discover how much business is invested in each carrier.
- Commissions: Identify top revenue performing agents and uncover missing commissions.
AgencyBloc’s clients have already seen how analytics have improved their business. Mike C., VP of Vesta Voluntary Specialists, “Charts and graphs are great communication tools which help visualize our processes and growth, as well as deficiencies in areas which need improvement.”
AgencyBloc strives to help life and health insurance agencies grow their business by organizing and automating their operations using a combination of an industry-specific CRM, commissions processing, and integrated marketing automation.
To learn more about AgencyBloc’s Dashboard Analytics feature, sign up for a 1-on-1 demo or start a free trial.
About AgencyBloc: AgencyBloc is an agency management system with commissions processing capabilities built specifically for life and health insurance agencies. For more information, contact AgencyBloc at 866-338-7075 or[email protected].