LarkspurRixtrema
Expert
- 31
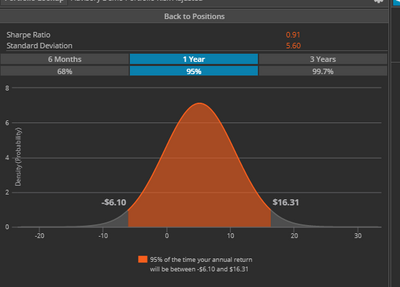
One of the most obvious ways to look at the risk of portfolio is by checking its standard deviation. Standard deviation is a statistical measurement that sheds light on historical volatility. The higher standard deviation is the more risk a portfolio has. Also, looking at Value at Risk will give you an approximation of possible loss/gain over specified period of time with selected degree of confidence. For example, the annualized standard deviation of well diversified portfolio on the screenshot is 5.6, whereas the annualized standard deviation of SP 500 is about 10.
So, the portfolio analyst can conclude that diversified portfolio is less risky than SP 500. Also, the distribution chart below can be interpreted as that the diversified portfolio can lose no more than ~6.1% or gain no more than 16.31% over 1 year period based on the confidence level of 95%. In other words, this is a loss/gain probability bend if portfolio moves 2 standard deviations over the period of 1 year.
Read more:
Ways You can help 401k Participants understand the risk of their portfolios