Go-to Annuity company

I'm not sure about that, but I am not a math heavyweight.

We may be talking past each other.

I dont know how else to say it.

An annual gain is a 12 month gain.

A 12 month gain is the sum of those 12 months added together.

An annual gain is just the combined 12 months added together.

Yes, its 2 points in time. But those 2 points in time are made up of 13 different points in the middle.
 
I dont know how else to say it.

An annual gain is a 12 month gain.

A 12 month gain is the sum of those 12 months added together.

An annual gain is just the combined 12 months added together.

Yes, its 2 points in time. But those 2 points in time are made up of 13 different points in the middle.

As I said, my mathematical skills are very poor; but with the limited understanding I have I cannot agree with those statements in the context of this discussion, which, from my perspective, is about comparing FIA returns based on annual and monthly stock index change computations --in percents.
 
Monthly sum is a tough one, there is often a bad month or two during the year that the total gained can't outrun the losses, to net much gain. Regardless of the index calculations and who believes what, personally, I wouldn't buy an annuity from F&G, ever.
 
Its just simple math. Its not in carrier sales material because its an over explanation.

The gain between 2 points, that are 12 months apart, mathematically is the sum of those 12 months.

An annual gain, by definition, is the sum of the 12 months.

If you get 2% per month for a year, you have a 12% gain.

So the yearly gain is 12%, but 12 months of 2% gains is what created that 12% gain.

So a 1y Point to Point gain is just the sum of those 12 months.

Im not arguing against your market timing comments. If you are worried about a single month causing bad returns then Monthly Average would be the best option to choose.

Just pointing out the technical aspect that a an annual gain is just a 12 month gain... meaning the gain of those 12 months is added up. That is just math.

Hate to say this, but put me in the "I don't get it" category with LD. If you have a 2% gain during each of 12 months, isn't that an annual gain of 27% (which is 1.02 raised to the 12th power = 1.27)? And the annual statements I've seen on 12 month P2P FIA's merely show the beginning S&P, the ending S&P, and apply the difference either way. I never saw any monthly references at all. Am I missing something? I don't see how you get from 2% monthly to 12%. Even if you ignored the compounding, that would be 24%, right?

All that being said, I agree that most of the time monthly P2P is not a great strategy.
 
Last edited:
Hate to say this, but put me in the "I don't get it" category with LD. If you have a 2% gain during each of 12 months, isn't that an annual gain of 27% (which is 1.02 raised to the 12th power = 1.27)? And the annual statements I've seen on 12 month P2P FIA's merely show the beginning S&P, the ending S&P, and apply the difference either way. I never saw any monthly references at all. Am I missing something? I don't see how you get from 2% monthly to 12%. Even if you ignored the compounding, that would be 24%, right?

All that being said, I agree that most of the time monthly P2P is not a great strategy.
It isn't locked in monthly so it doesn't compound. You could have 6 months of 2% gains and in month 7 the market is down 12% and erase all of your gains.

I think that example was just a simple error but the crux of what he's saying is still true.

Most carriers don't market these anymore because they confuse everyone so you're not alone.
 
Hate to say this, but put me in the "I don't get it" category with LD. If you have a 2% gain during each of 12 months, isn't that an annual gain of 27% (which is 1.02 raised to the 12th power = 1.27)? And the annual statements I've seen on 12 month P2P FIA's merely show the beginning S&P, the ending S&P, and apply the difference either way. I never saw any monthly references at all. Am I missing something? I don't see how you get from 2% monthly to 12%. Even if you ignored the compounding, that would be 24%, right?

All that being said, I agree that most of the time monthly P2P is not a great strategy.

Sorry. You are correct, I just mistyped the return and should have typed 24%.

My point with LD, was that all crediting methods are using 12 months of returns to calculate the gains. (excluding multi-year strategies)

He said that Annual P2P is not taking into account each months gain. That is incorrect. By definition Annual P2P is just the cumulative total of the 12 months.

Literally all 3 methods are a sum of the 12 contract months. Just with varying ways to limit upside.

Annual P2P adds up the 12 months, and imposes a Cap after all are added together.

Monthly P2P adds up the 12 months, but imposes a Cap each month before they are added together.

Monthly Avg adds up the 12 months, then divides by 12 after all are added together.


All 3 are 12 months added together, just different ways to regulate upside.
 
Is the Athene MYG sold through agents, or does one need to communicate directly with Athene to buy it?

Do carriers have provisions for direct sales to consumers when a consumer's desired annuity premium falls below an amount an agent will accept for a sale?
 
Is the Athene MYG sold through agents, or does one need to communicate directly with Athene to buy it?

Do carriers have provisions for direct sales to consumers when a consumer's desired annuity premium falls below an amount an agent will accept for a sale?

It is sold by agents. I do not know of any carriers with an avenue for direct sales of annuities to consumers.
 
Sorry. You are correct, I just mistyped the return and should have typed 24%.

My point with LD, was that all crediting methods are using 12 months of returns to calculate the gains. (excluding multi-year strategies)

He said that Annual P2P is not taking into account each months gain. That is incorrect. By definition Annual P2P is just the cumulative total of the 12 months.

Literally all 3 methods are a sum of the 12 contract months. Just with varying ways to limit upside.

Annual P2P adds up the 12 months, and imposes a Cap after all are added together.

Monthly P2P adds up the 12 months, but imposes a Cap each month before they are added together.

Monthly Avg adds up the 12 months, then divides by 12 after all are added together.


All 3 are 12 months added together, just different ways to regulate upside.

Caveat, not an agent.

Annual P2P adds up the 12 months, and imposes a Cap after all are added together.

This is not the way Annual Point to Point is explained in annuity reference material I find.

Two examples:

https://www.investopedia.com/terms/i/interestcrediting-methods.asp
Indexed annuities return cash flows linked to the performance of an equity index, such as the S&P 500 index, but with a cap on the maximum return that will be credited. In a point-to-point interest-crediting method, any increase in the value of an index is calculated from two points in time. This is the simplest interest-crediting method to calculate, but it may not provide an annuity contract holder with the most benefit. For example, if an index was valued at 1,000 at the beginning of the time period and increased to 1,150 by the end, the point-to-point method would call this a 15 percent increase (150/1000 x 100). If the index decreases in value no interest will be added to the contract, though the contract won’t lose its value.

https://www.midlandnational.com/doc...Brochure/ec7e980d-9f18-43cb-9f14-5683dc92bba2

Annual Point-to-Point is calculated by subtracting the beginning index value from the ending index value. The difference is then
divided by the beginning index value; this amount is called the percent of index value change. This percentage can either be
positive or negative.
 
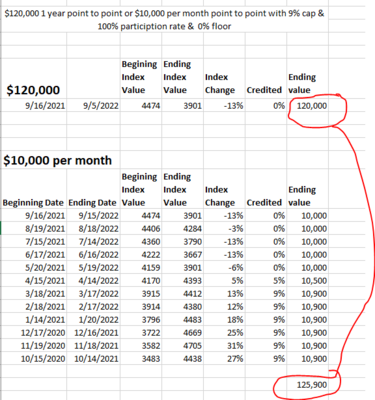
Lets attempt to settle/explain this.

I believe this is what people are somewhat saying when thinking about this topic......but maybe not. Not saying this is the thought, but I think this is why there is a debate here as to whether 1 day a year ends up being equal to 12 months.

Here is comparison of the last 12 months had someone had 100% in an index product with 0% floor, 9% cap & 100% participation rate. $120,000 from 1 day last year to 1 day this year compared to having $10,000 each month having 1 day, so therefore 12 days. A person doing this the last 12 months would be substantially better, having been able to make almost 4% instead of a 13% loss (0% credited)

PS-- reminds me of how I would love to find a way to start dollar cost averaging back in the market right now on a daily incremental basis, but most places I find only allow it to be set up on a monthly basis & who wants to guess at mutual fund/ETF value on 21 different days a month?

upload_2022-9-24_13-9-53.png
 
Back
Top