Navigation
Install the app
How to install the app on iOS
Follow along with the video below to see how to install our site as a web app on your home screen.
Note: This feature may not be available in some browsers.
More options
Manhattan life is getting out.
- Thread starter Medicare bro
- Start date
By far, the largest amount spent ($11,089 per person) was for the elderly (age 65 or over), with Medicare covering almost one-half of these costs.
 pmc.ncbi.nlm.nih.gov
Age Estimates in the National Health Accounts - PMC
This article presents historical trends of health spending by age. Personal health care is broken out into seven age groups for 1987, 1996, and 1999. Analysis of trends in health care spending is provided separately for children (age 0-18), ...
Just a waggle.......deferred maintenance. I'm seeing an unreal amount of turning 65 who are waiting until they are on Medicare to have/get Medical care. Unintended consequences and the ACA had many. Cost is the biggest. Whether it be premiums, because of no subsidies or deductibles and MOOP.What is causing the high loss ratios? Is this still the corona effect?
Wish we had some data, but it wouldn't surprise me if just turned 65 had usage rates as high as 90 year olds.
wouldn't surprise me if just turned 65 had usage rates as high as 90 year olds.
Anecdotal only, but I see a small percentage waiting until 65 to replace joints, correct cataracts, etc but these are usually one offs. The chronic things kick in closer to 70 or so.
The link in post 13 doesn't isolate T65 but does show claims for 65 -74 vs later brackets.
Packerland
Guru
- 591
Loss ratios came from CSA ActuarialThose loss ratios seem off.
See the 4/3 newsletter - loss ratios are in the 80%s (except Aetna in low 90s)
- 31,192
Fixed that for you.Loss ratios came from CSG Actuarial
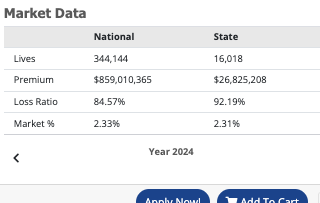
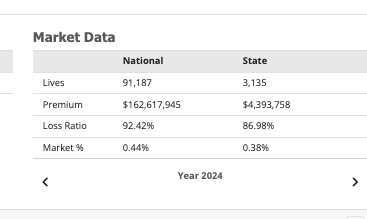
not sure whether I'm looking at it wrong or the other agent is but here is Omaha from CSG
ALL the numbers are overstated vs CSG.
I am not suggesting that CSG is correct and the "other" data is wrong, but there is a SIGNIFICANT variation in the two tables.
Number of lives shown for Omaha doesn't match CSG.
Also, I find it interesting that CSG offer LR information for Medigap but not for MA plans. Wonder why . . .
Similar threads
- Replies
- 7
- Views
- 444
- Replies
- 125
- Views
- 6K
- Replies
- 18
- Views
- 503
- Replies
- 1
- Views
- 238
Latest posts
-
Postage going up another 7.4%. Legitimate dm has a few yrs left
- Latest: theinsuranceman
-
-
-


